Analytics built for modern support teams
Measure what matters: from SLAs and backlog trends to AI impact and customer satisfaction. Coach teams, improve response times, and prove ROI with real-time dashboards.

Turn visibility into outcomes
Track productivity, workload balance, and SLAs across every channel. Spot coaching moments and recognize top performers.
See AI vs human resolutions, confidence trends, deflection rates, and monthly cost savings.
Spot trends, schedule reports, and make faster decisions, no manual exports or data wrangling.
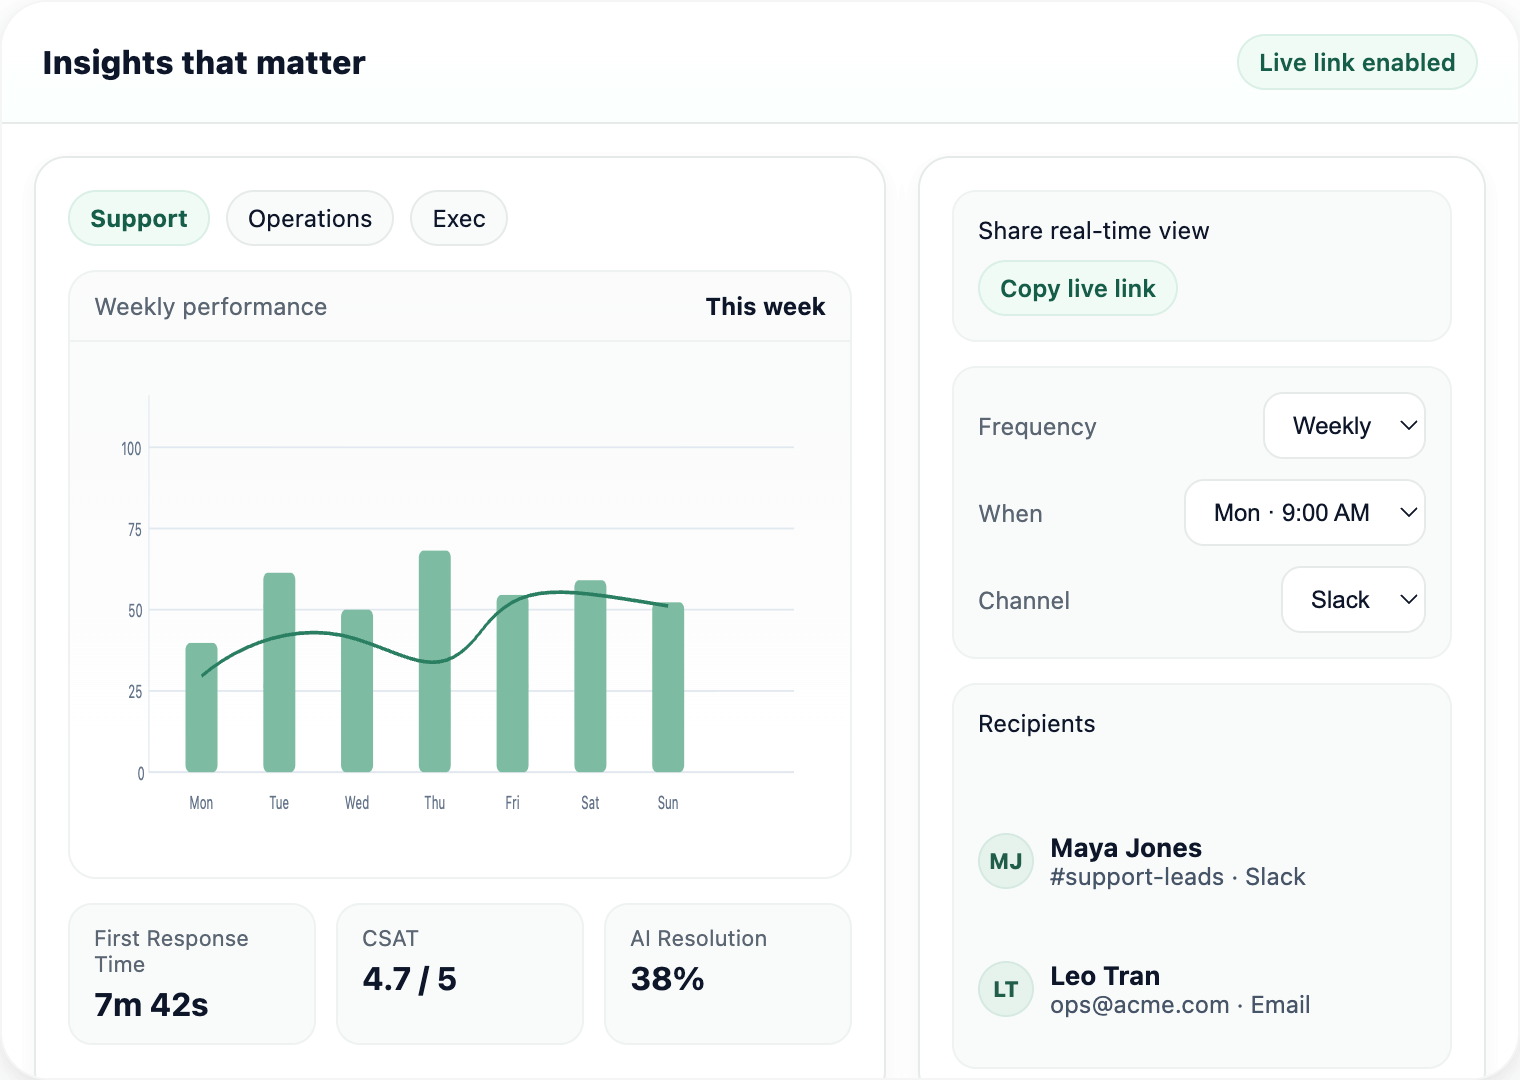
Bring analytics to every stakeholder
Customize dashboards for any role and schedule weekly reports to Slack or email. Share real-time views without exporting spreadsheets.
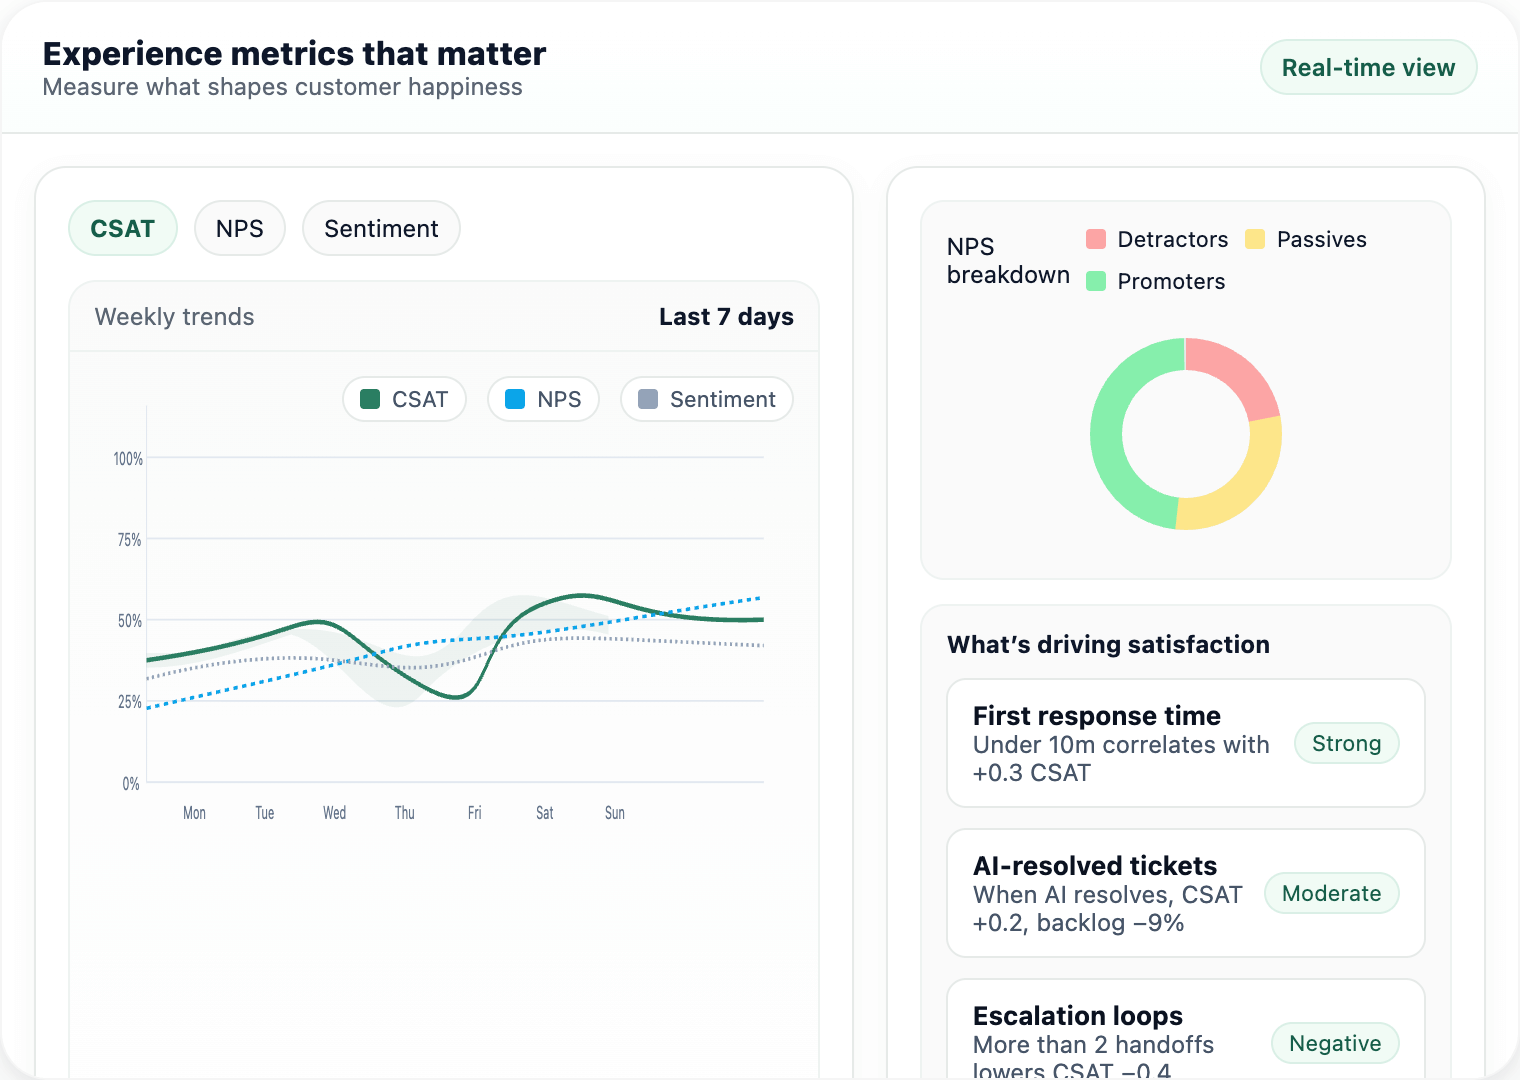
Measure what shapes customer happiness
Monitor CSAT, NPS, and sentiment trends to understand what drives satisfaction. See how workflows and response times impact outcomes.
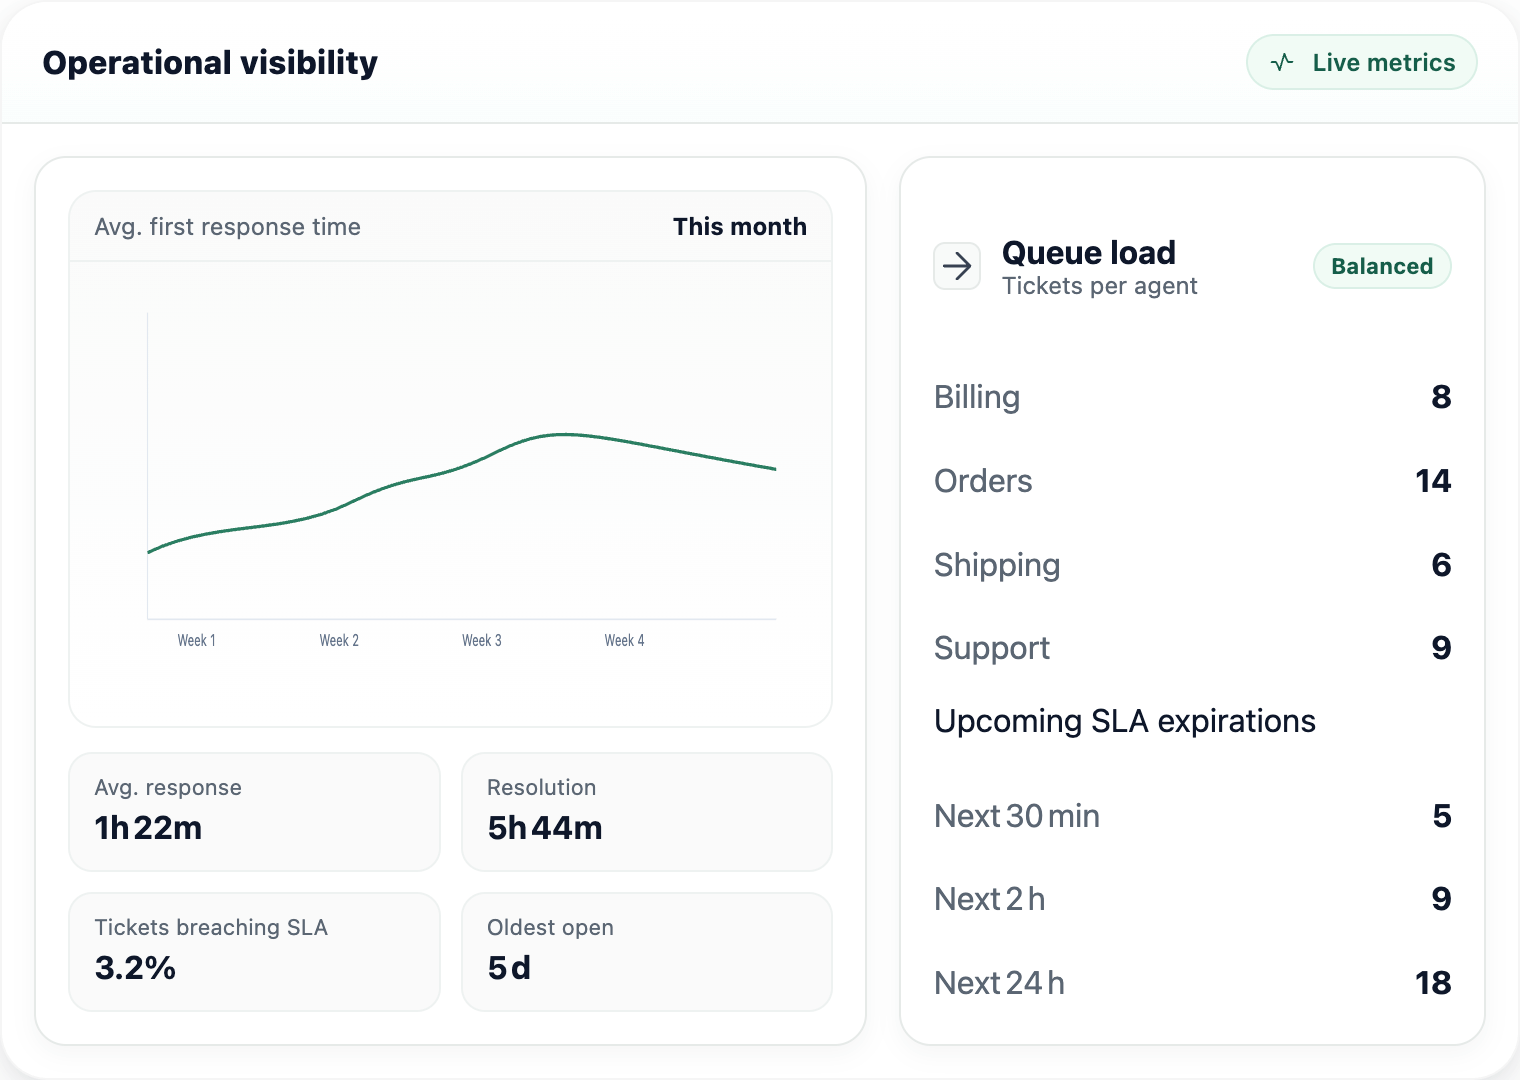
Optimize every agent and queue
Drill into response and resolution times, ticket aging, and SLA attainment. Identify bottlenecks early and rebalance workload before issues escalate.
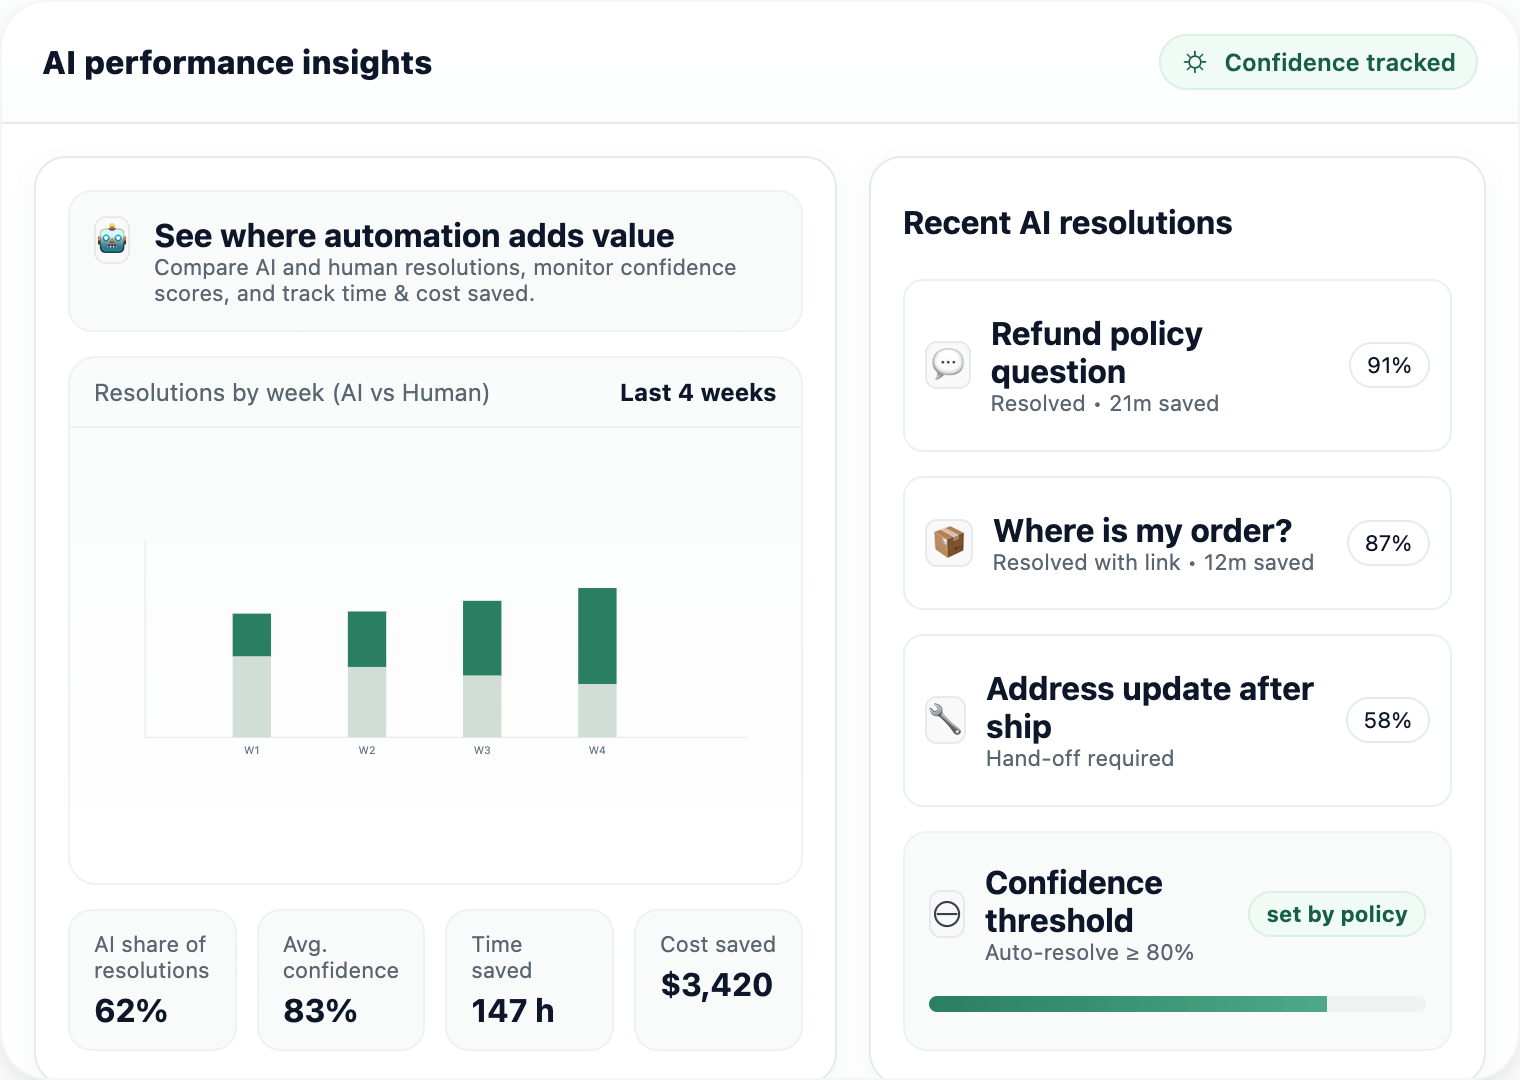
See where automation adds value
Compare AI and human resolutions, monitor confidence scores, and track time and cost saved. Keep full visibility into every automated interaction.
Start your free 14-day trial
Get set up in minutes. No credit card required.